
A T-chart is a type of graphic organizer that helps to organize and compare information clearly and concisely. It consists of a T-shaped table with two columns, allowing for easy comparison of two different subjects or ideas. The vertical line of the T represents the dividing line between the two columns, while the horizontal line represents the categories or criteria being compared.
A T-chart can be used in various settings, such as classrooms, offices, or even at home, to aid in decision-making, analysis, and understanding of different concepts. It is a versatile tool that can be customized and adapted to suit individual needs and preferences.
Why Use a T-Chart?
There are several reasons why using a T-chart can be beneficial:
- Organization: A T-chart provides a structured format for organizing and presenting information. It helps to visually separate and categorize different aspects, making it easier to comprehend and analyze.
- Comparison: The two-column structure of a T-chart allows for easy comparison of different subjects or ideas. It highlights similarities and differences, providing a clear overview of the topic at hand.
- Clarity: By using a T-chart, complex information can be broken down into simpler components. It helps to clarify concepts, identify patterns, and make connections between different elements.
- Decision-making: When faced with multiple options or alternatives, a T-chart can help in weighing the pros and cons. It provides a visual representation of different factors, enabling better decision-making.
- Communication: A T-chart can be a useful tool for presenting information to others. It allows for effective communication of ideas, data, or arguments in a concise and organized manner.
How to Create a T-Chart
Creating a T-chart is a simple process. Here’s how you can do it:
- Choose a topic: Determine the subject or idea you want to compare and organize using a T-chart.
- Identify categories: Decide on the categories or criteria you want to use for comparison. These could be specific attributes, characteristics, or aspects of the topic.
- Draw the T-chart: Using a pen or pencil, draw a vertical line down the center of a blank sheet of paper. At the top of each column, write the category or criteria being compared.
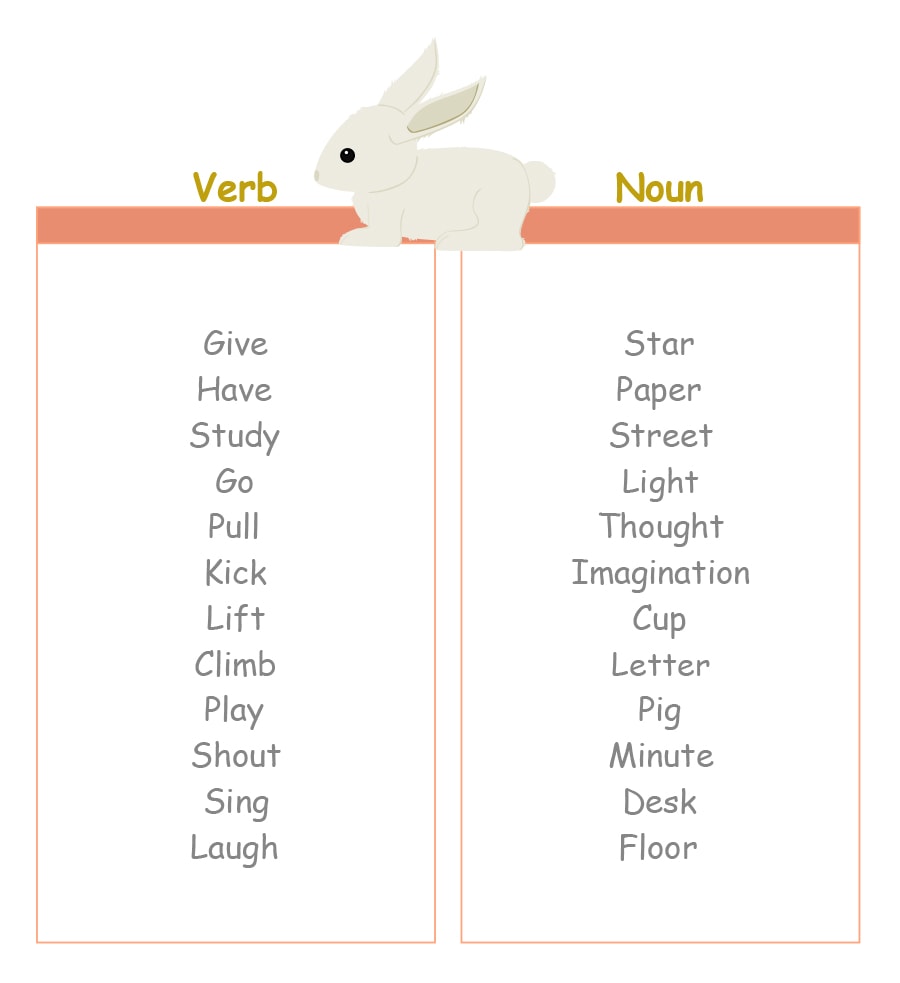
- Add information: Fill in the T-chart with relevant information for each category. This could be in the form of words, phrases, or even images.
- Analyze and interpret: Once the T-chart is complete, analyze the information and look for patterns, similarities, and differences between the categories.
Example of a T-Chart
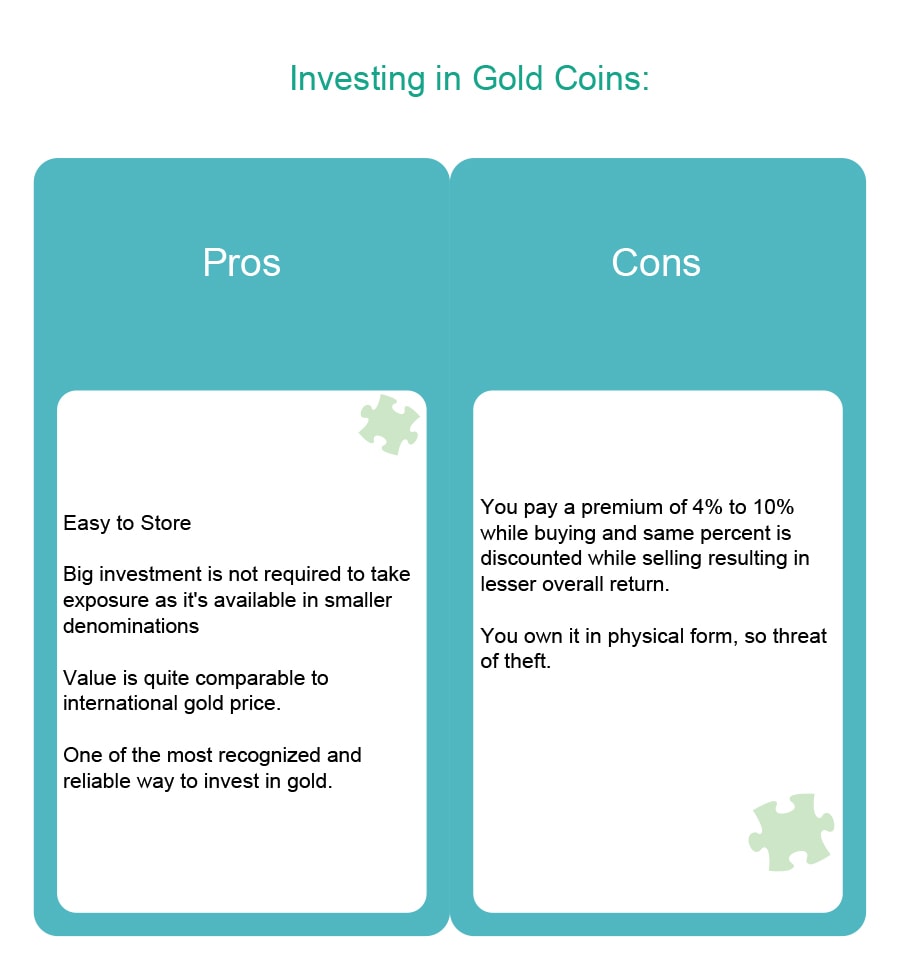
Let’s say you want to compare the advantages and disadvantages of using print media versus digital media for advertising. Here are some examples of how a T-chart for this topic could look:







Tips for Successful Use of T-Charts
To make the most out of using T-charts, consider the following tips:
- Be specific: Clearly define the categories or criteria you want to compare. This will help in ensuring accurate and meaningful comparisons.
- Use concise language: Keep the information within the T-chart brief and to the point. Avoid lengthy sentences or explanations.
- Choose a suitable format: Depending on the nature of the information, you can use different formats within the T-chart, such as words, phrases, or even visual elements like icons or symbols.
- Update and revise: T-charts are dynamic tools that can be modified as new information becomes available or as your understanding of the topic evolves.
- Combine with other tools: T-charts can be used in conjunction with other graphic organizers or note-taking techniques to enhance organization and understanding.
- Practice active engagement: While creating and analyzing a T-chart, actively engage with the information by asking questions, making connections, and drawing conclusions.
- Experiment and adapt: Don’t be afraid to experiment with different layouts, styles, or formats to find what works best for you. Adapt the T-chart to suit your specific needs and preferences.
Conclusion
A T-chart is a valuable tool for organizing and comparing information in a structured and visual manner. It helps to clarify concepts, analyze data, and make informed decisions. By following the steps outlined in this guide and considering the tips provided, you can effectively create and utilize T-charts to enhance your understanding and communication of various subjects or ideas.
T-Chart Template Word – Download