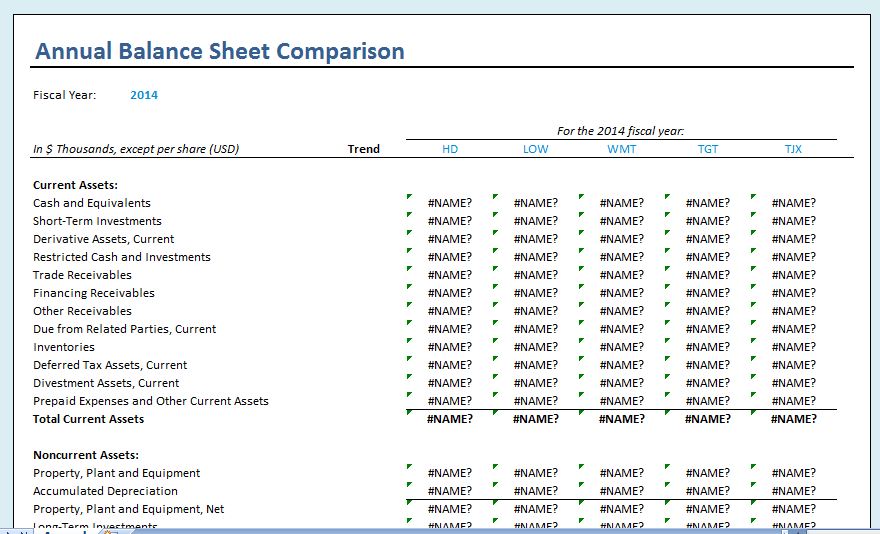
A balance sheet is a financial statement that provides a snapshot of a company’s financial position at a specific point in time. It shows the company’s assets, liabilities, and shareholders’ equity. A balance sheet is an essential tool for evaluating a company’s financial health and performance.
This article will dive deep into the concept of a yearly comparison balance sheet, exploring its purpose, benefits, and how to create one. Whether you are a business owner, accountant, or financial analyst, understanding this financial statement will help you make informed decisions and assess the financial stability of a company.
What is a Yearly Comparison Balance Sheet?
A yearly comparison balance sheet is a financial document that provides a side-by-side comparison of a company’s balance sheets for multiple years. It allows you to analyze a company’s financial performance over time and identify trends, patterns, and changes in its financial position.
By comparing balance sheets from different years, you can gain insights into a company’s financial stability, growth, and profitability.
Why Use a Yearly Comparison Balance Sheet?
Using a yearly comparison balance sheet offers several benefits. Here are some reasons why it is a valuable tool for financial analysis:
- Identify trends: By comparing balance sheets from multiple years, you can identify trends in a company’s financial performance. This can include changes in assets, liabilities, and shareholders’ equity.
- Evaluate financial stability: A yearly comparison balance sheet helps you assess a company’s financial stability by looking at its liquidity, solvency, and overall financial health.
- Measure growth: By analyzing the changes in a company’s balance sheet over time, you can measure its growth and expansion. This includes increases in assets, revenue, and profits.
- Spot potential issues: A yearly comparison balance sheet can help you identify potential financial issues or red flags. This can include changes in debt levels, declining profitability, or deteriorating asset quality.
- Make informed decisions: Armed with the insights gained from a yearly comparison balance sheet, you can make more informed financial decisions. This includes evaluating investment opportunities, assessing creditworthiness, and setting financial goals.


How to Create a Yearly Comparison Balance Sheet
Creating a yearly comparison balance sheet involves several steps. Here is a step-by-step guide to help you get started:
- Gather financial statements: Collect the balance sheets for each year you want to compare. Ensure that the financial statements are accurate and up to date.
- Organize the data: Arrange the data from each balance sheet in a consistent format. This includes listing the assets, liabilities, and shareholders’ equity in separate sections.
- Calculate changes: Calculate the changes in each category of the balance sheet between the years being compared. This can be done by subtracting the previous year’s value from the current year’s value.
- Create a comparison table: Create a table that presents the data in a clear and organized manner. Use columns to represent each year and rows to represent the different categories of the balance sheet.
- Highlight significant changes: Identify and highlight any significant changes or trends in the comparison table. This can include increases or decreases in specific categories or ratios.
- Provide analysis and interpretation: Write a detailed analysis and interpretation of the comparison table. Explain the key findings, trends, and implications of the changes in the balance sheet over time.
- Format for printing: Once the comparison table and analysis are complete, format the document for printing. Ensure that it is easy to read and visually appealing.
Example of a Yearly Comparison Balance Sheet
Here is an example of a yearly comparison balance sheet for a fictional company:
Company XYZ
| Category | 2019 | 2020 | 2021 |
|---|---|---|---|
| Assets | $500,000 | $600,000 | $700,000 |
| Liabilities | $200,000 | $250,000 | $300,000 |
| Shareholders’ Equity | $300,000 | $350,000 | $400,000 |
In this example, we can see that Company XYZ has experienced steady growth in both its assets and shareholders’ equity over the three years. However, liabilities have also increased, indicating a higher level of debt. This information can be further analyzed to assess the company’s financial health and stability.
Tips for Successful Yearly Comparison Balance Sheets
Here are some tips to ensure the success of your yearly comparison balance sheets:
- Use consistent accounting methods: To ensure accurate comparisons, use consistent accounting methods and principles across all years being compared.
- Include relevant footnotes: If there are any significant events or transactions that impact the balance sheet, include relevant footnotes to provide additional context.
- Consider industry benchmarks: Compare your company’s balance sheet to industry benchmarks or competitors to gain a broader perspective on its financial performance.
- Regularly update and review: Update your yearly comparison balance sheets regularly to reflect the most recent financial information. Review the data periodically to track changes and identify new trends.
- Seek professional advice when needed: If you are unsure about any aspect of creating or analyzing a yearly comparison balance sheet, seek the guidance of a professional accountant or financial advisor.
Free Yearly Comparison Balance Sheet Template!
A yearly comparison balance sheet is a powerful tool for assessing a company’s financial performance and stability. By comparing balance sheets from different years, you can gain valuable insights into a company’s growth, profitability, and overall financial health.
By following the steps outlined in this guide and considering the tips provided, you can create effective and informative yearly comparison balance sheets that will aid in making informed financial decisions.
Yearly Comparison Balance Sheet Template Excel – Download